Body Fat Percentage Chart for Men and Women by Age
☰ Table of Contents
- 1. What Body-Fat Percentage Measures
- 2. General Reference Ranges for Adults
- 3. Why Age and Sex Affect the Chart
- 4. How Body Fat Is Estimated
- 5. How to Compare Results Over Time
- 6. Setting a Realistic Body-Composition Goal
- 7. Body Fat, BMI, and Waist Size
- 8. How to Apply This body fat percentage chart Guide
- 9. Sources and Further Reading
- Body-fat percentage estimates the proportion of total body weight that is fat mass
- Reference charts are broad guides; they are not diagnostic cutoffs
- Different measurement methods can produce noticeably different estimates
- Compare trends only when the same method and similar conditions are used
- Very low or unexpectedly changing values deserve professional context
What Body-Fat Percentage Measures
Body-fat percentage is estimated fat mass divided by total body mass, multiplied by 100. A result of 25% means roughly one quarter of measured body weight is estimated to be fat tissue; it does not show where that fat is stored.
Some body fat is essential for normal physiological functions. The amount associated with health and performance varies with sex, age, genetics, hormonal status, and measurement method, so a chart should be treated as orientation rather than a personal prescription.
General Reference Ranges for Adults
There is no single universal body-fat classification used for diagnosis. The broad ranges below are practical reference bands commonly used in fitness settings, not medical thresholds.
| General band | Men | Women |
|---|---|---|
| Essential range | About 2–5% | About 10–13% |
| Athletic range | About 6–13% | About 14–20% |
| Fitness range | About 14–17% | About 21–24% |
| General range | About 18–24% | About 25–31% |
Do not chase the lowest band. Athletic-looking values are not necessary for health and may be difficult or inappropriate to maintain.
Why Age and Sex Affect the Chart
Women generally carry more essential fat because of reproductive and hormonal biology. Average body composition also changes with age, often with a gradual loss of lean tissue unless strength and activity are maintained.
That does not mean everyone should accept a fixed age-based target. It means comparisons are more useful when made with an appropriate peer group and interpreted alongside strength, mobility, waist size, metabolic health, and quality of life.
How Body Fat Is Estimated
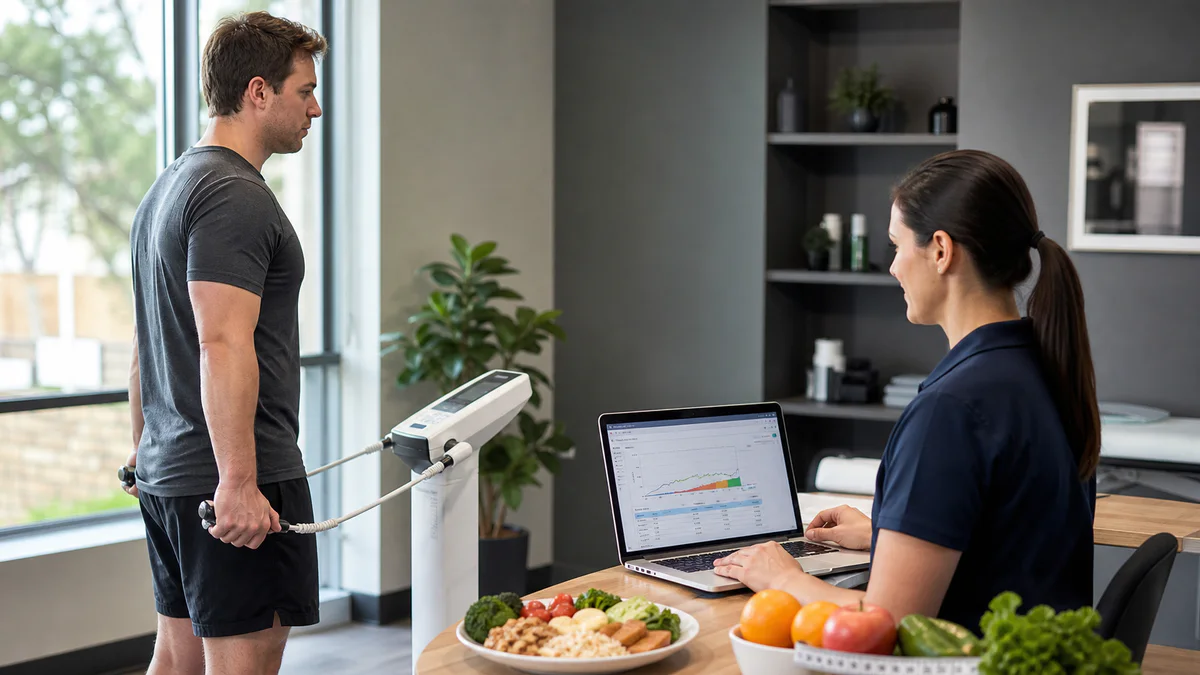
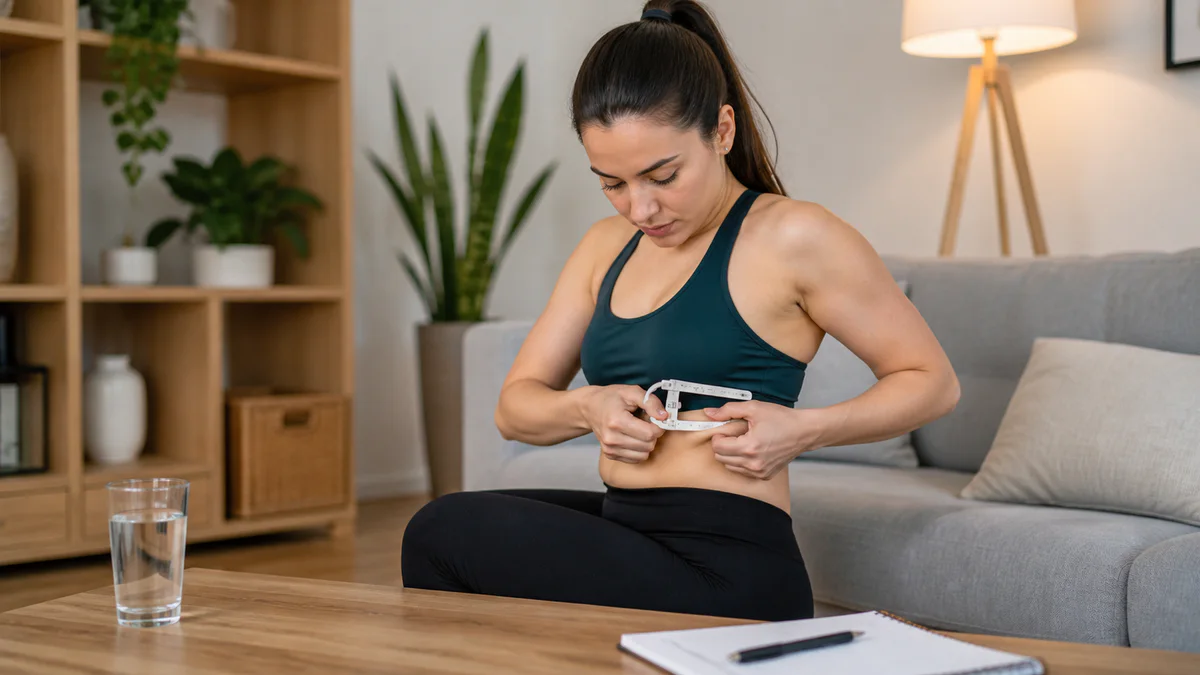
Home scales usually use bioelectrical impedance analysis (BIA). Skinfold callipers estimate subcutaneous fat at selected sites. Air-displacement plethysmography and dual-energy X-ray absorptiometry (DXA) are more specialised. Each method relies on different assumptions.
Hydration, recent food, exercise, skin temperature, device equations, and technician skill can affect results. A home scale can be useful for a trend, but its displayed decimal places should not be mistaken for laboratory precision.
How to Compare Results Over Time
Use the same device, at a similar time of day, under similar hydration and meal conditions. Compare several readings over weeks rather than reacting to one value. Record waist circumference, strength, and how clothes fit if those measures match your goal.
If two methods disagree, do not average them. Choose one repeatable method for tracking, and use a clinical assessment when the exact estimate matters.
Setting a Realistic Body-Composition Goal
Start with the reason for changing body composition: health, sport, comfort, or performance. A sustainable plan usually combines adequate nutrition, resistance training, routine movement, sleep, and a pace that preserves energy and function.
Rapid weight loss can include water and lean tissue, so scale change is not automatically fat loss. People with a history of disordered eating, pregnancy, unexplained weight change, or a medical condition should seek individual guidance.
Body Fat, BMI, and Waist Size
BMI screens weight relative to height; body-fat percentage estimates composition; waist size provides information about abdominal distribution. None tells the whole story. Used together, they can support a more informed conversation.
Clinical decisions may also depend on blood pressure, glucose, lipids, symptoms, medications, and family history. A visually “lean” appearance does not guarantee metabolic health, and a higher body-fat estimate does not define a person’s health by itself.
How to Apply This body fat percentage chart Guide
When applying body fat percentage chart, personal context matters: body-fat goals should account for age, sex, training demands, menstrual or hormonal function, medical history, and the reason for measuring. A lower percentage is not automatically healthier, and a single reference chart cannot define the best level for every person.
A workable body fat percentage chart plan should follow this principle: when fat loss is appropriate, combine a moderate energy deficit with progressive resistance training, adequate protein, varied food, sleep, and recovery. That approach is more protective of lean tissue and performance than rapid restriction or large volumes of compensatory exercise.
For body fat percentage chart, choose one primary outcome and use the same method long enough to see a meaningful pattern. Use several indicators over a realistic time frame: waist measurements, strength, clothing fit, average body weight, and one consistent composition method. Day-to-day readings are too noisy to justify abrupt calorie or training changes.
The aim is not to follow every possible tip. It is to use the article’s main evidence—starting with “Body-fat percentage estimates the proportion of total body weight that is fat mass”—to make one realistic decision, observe the result, and adjust without losing sight of health, function, and sustainability.
Sources and Further Reading
- CDC: BMI as a screening measure and its limitations
- Endotext: clinical assessment of body composition and obesity
- NIDDK: choosing a safe weight-management program
Ready to get a starting estimate? Try our free Body Fat Calculator — instant and no sign-up needed.
Try Free Calculator →Important FAQs About body fat percentage chart

Body Composition Knowledge Quiz
Test your understanding of body fat, lean mass, BMI, and the science of body composition assessment.
Take Quiz →Biological Ageing Knowledge Quiz
How much do you know about biological ageing, longevity science, and the habits that extend a health...
Take Quiz →